System Health Checks: The Full-Stack Guide Devs Need
August 23, 2026
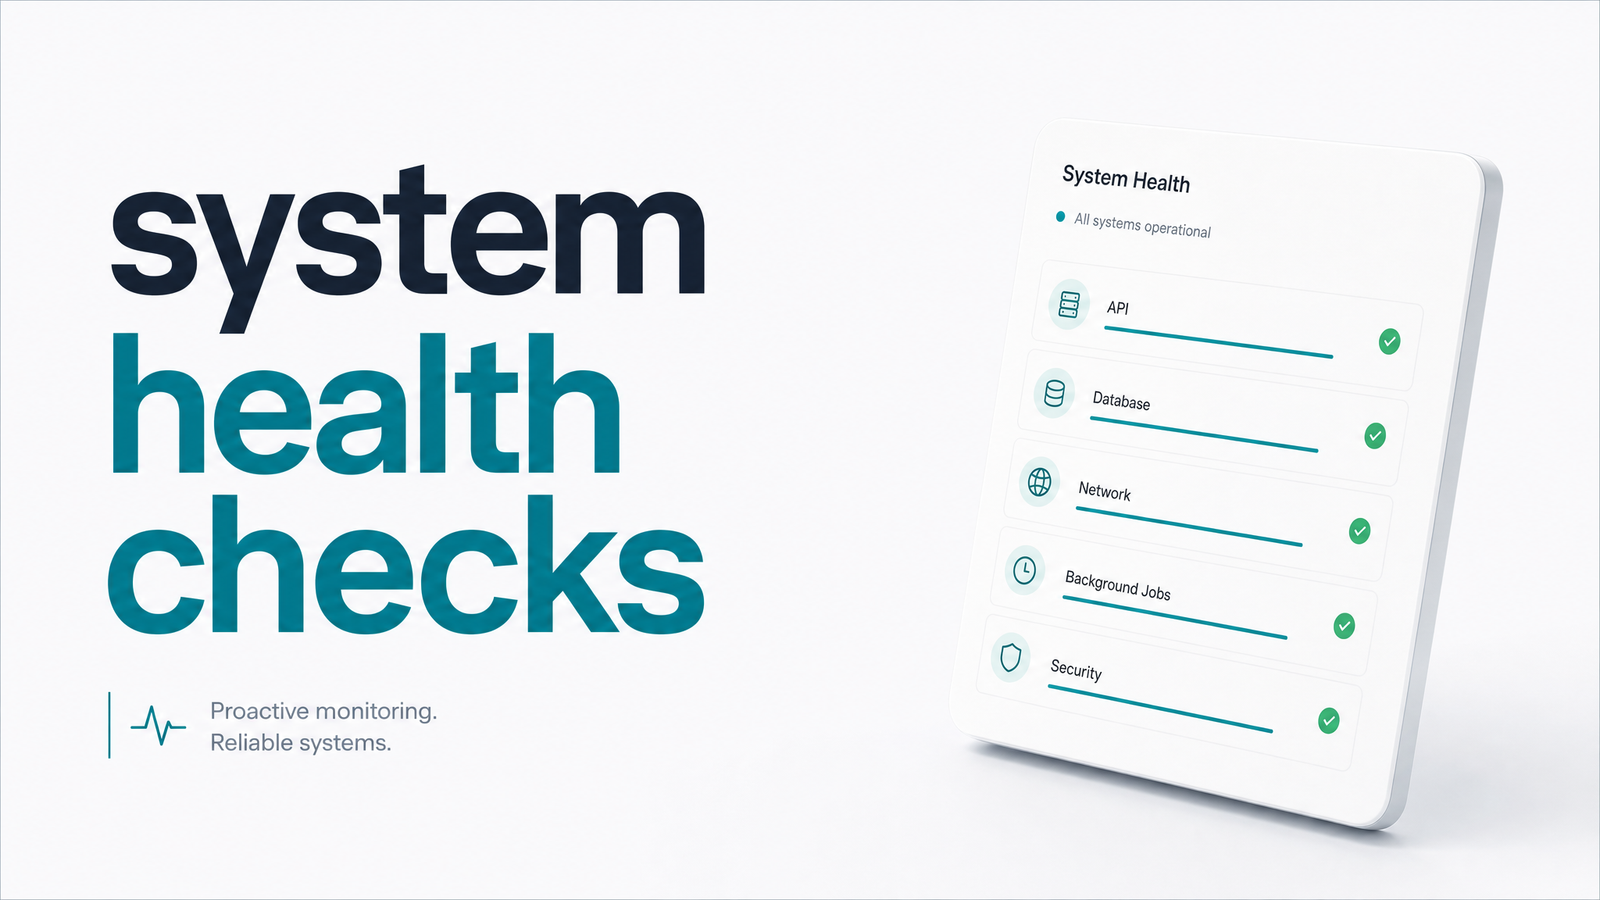
What Is a System Health Check?
A system health check is an automated verification that a component — a server, a service, an endpoint, or a scheduled job — is functioning as expected. The point is narrow: it's about catching failure before users or downstream systems do, not understanding why something failed. That's the line between a health check and general monitoring. Monitoring collects metrics, logs, and traces so humans can diagnose problems. A health check is a pass/fail signal designed to trigger automated action — restart a container, remove a node from a load balancer, or fire an alert.
So the honest answer to "what is a system health check" is: it's the tripwire, not the investigation. Most teams have some version already — a /healthz endpoint, a container health check, an uptime monitor pinging the homepage. The problem isn't lacking health checks; it's assuming the checks they have are complete, when most setups only cover a fraction of the system.
The 4 Types of Health Checks
Before finding gaps, you need a way to classify what you already have. There are four common types, each answering a different question.
- Liveness checks answer "is this process still running, or should it be restarted?" They're intentionally minimal — a process can be alive but unable to serve traffic.
- Readiness checks answer "is this instance ready to accept traffic right now?" A service can be alive but not ready if it's still loading data or waiting on a dependency.
- Synthetic/uptime checks answer "can an external caller reach this endpoint and get the expected response?" These simulate real user or client requests from outside the system, often on a schedule from a third-party location.
- Heartbeat checks answer "did this process check in when it was supposed to?" Instead of pinging a target, the target pings the monitor — the basis of a dead man's switch, and the mechanism that matters most for background work with no traffic to probe.
This liveness vs readiness distinction, plus the addition of startup probes for slow-booting services, is documented in Octopus Deploy's breakdown of Kubernetes health check types, and Webalert's guide to designing /healthz, /livez, and /readyz endpoints is a solid reference if you're building these from scratch.
The 4 Layers a Complete Health Check Strategy Covers
Types tell you how a check works. Layers tell you where you need one. A complete strategy covers four layers, and skipping any one leaves a blind spot regardless of how sophisticated your checks are elsewhere.
Infrastructure — CPU, memory, disk, and network I/O on the machines or containers running your workloads. Healthy means resources stay within thresholds that won't degrade performance or trigger OOM kills. Zuzia's server health check best practices covers the specific metrics and thresholds worth alerting on.
Application — the service layer: database connections, cache availability, downstream API dependencies, queue depth. This usually means a readiness check that actually verifies dependencies, not just that the process is up.
Network and external services — DNS resolution, third-party API availability, CDN response times. Healthy means the paths between your system and the outside world are intact, independent of whether your own code is fine.
Scheduled and background jobs — reports, syncs, backups, cleanup tasks, anything that runs on a timer rather than in response to a request. Healthy means the job ran, ran on time, and completed successfully. This is the layer that gets left out.
The Layer Most Health Checks Miss: Scheduled Jobs
Liveness probes, readiness probes, and synthetic monitors all assume something is generating traffic they can inspect. A liveness probe hits a port; a synthetic check sends a request and reads the response. That model works for servers and APIs, and it breaks down for cron jobs, which have no port to hit and no request/response cycle to observe from outside.
A nightly backup script can silently stop firing because a cron entry got dropped in a deploy, hang indefinitely on a lock it never releases, or exit with a non-zero code nobody's watching for — and every container health check, uptime monitor, and Kubernetes probe in your stack will report green the entire time. This is the blind spot: the checks aren't wrong, they're just not designed to look at scheduled job monitoring at all. It's the same reason a container can report "healthy" while the cron job inside it has been dead for three days — covered in more depth in Docker Healthcheck: Full Syntax Guide + Why It Misses Cron. If you're running jobs across multiple workers or a distributed scheduler, Distributed Job Scheduling: How It Works, Where It Fails covers where that setup adds even more failure modes.
Building a System Health Check Strategy: A Practical Checklist
Use this as a working checklist rather than a one-time audit:
- Define "healthy" per component first. A vague check that just confirms a process exists tells you almost nothing useful.
- Separate liveness from readiness. Conflating them causes either premature restarts or traffic sent to instances that aren't ready.
- Keep checks lightweight. A health check that queries your whole database on every hit can create load problems of its own.
- Alert on trends, not single blips. One slow response or one missed poll is noise; three in a row is a signal — this is the single biggest fix for alert fatigue.
- Add job-level monitoring for anything outside the request path. If it runs on cron, a scheduler, or a queue worker with no HTTP entry point, it needs its own heartbeat or dead man's switch.
- Review coverage by layer, not by tool. Map infra, application, network, and scheduled jobs separately, and check that each has at least one relevant health check.
Teams building health check endpoints from scratch will find implementation details — timeouts, status codes, what to actually check inside the handler — in Healthcheck Test: A Practical Guide for Developers, and for container-specific troubleshooting, Docker Health Check: States, Commands, and Fixing Unhealthy is worth bookmarking.
Closing the Gap With Cronevra
Most teams reading this already have solid infra and application checks — Kubernetes probes, uptime monitors, maybe a status page. What they don't have is visibility into whether last night's sync job actually ran, or whether a scheduled HTTP job hung halfway through and never sent a completion signal. That's not a gap you close with another uptime check; it's a different type of check entirely, built around heartbeats and expected execution windows rather than request/response traffic.
Scheduled and background jobs are the one layer generic health checks structurally can't reach — there's no request to probe and, in serverless or ephemeral setups, often no container to inspect either. Cronevra exists specifically for this layer: it tracks execution history for your scheduled HTTP jobs and cron tasks, flags failures and missed runs, and alerts you on recovery so silent failures stop being silent. If you're already covering infra, app, and network, this is the piece that completes the picture — check the pricing page to see what fits your team.
Frequently Asked Questions
What counts as a system health check vs. general monitoring?
A health check is an automated pass/fail signal used to trigger action — like restarting a container or alerting on a missed job — while monitoring collects metrics and logs for human diagnosis. Health checks answer "is this working right now," monitoring answers "why did this happen." Most systems need both, but they serve different purposes.
What's the difference between liveness and readiness checks?
A liveness check confirms a process is still running and should not be restarted, while a readiness check confirms an instance is ready to receive traffic. A service can be alive but not ready — for example, while still connecting to a database on startup. Conflating the two causes either unnecessary restarts or traffic routed to unprepared instances.
How often should health checks run?
It depends on the layer: liveness and readiness checks typically run every few seconds since they gate traffic routing and restarts, while synthetic checks often run every one to five minutes. Heartbeat checks for scheduled jobs should align with the job's expected schedule plus a grace window, not a fixed short interval.
Why don't standard health checks catch failed cron jobs?
Standard health checks — liveness, readiness, uptime monitors — are built to inspect request/response traffic or a running process, and a cron job has neither a port to probe nor guaranteed traffic to observe. A job can stop firing, hang, or fail midway while every container and endpoint check nearby reports healthy. Catching this requires a heartbeat-style check where the job reports in, not one where a monitor reaches out.
What should a health check strategy include for a small team vs. a large infrastructure?
A small team should cover the basics at each layer: a liveness/readiness check on the main service, one uptime check on the public endpoint, and heartbeat monitoring on any scheduled jobs. A larger infrastructure needs the same four layers but with more granularity — per-service readiness checks, dependency-aware application checks, and job-level monitoring across distributed schedulers, not just a single cron host.