pgDash Explained: PostgreSQL Monitoring and Its Blind Spot
September 7, 2026
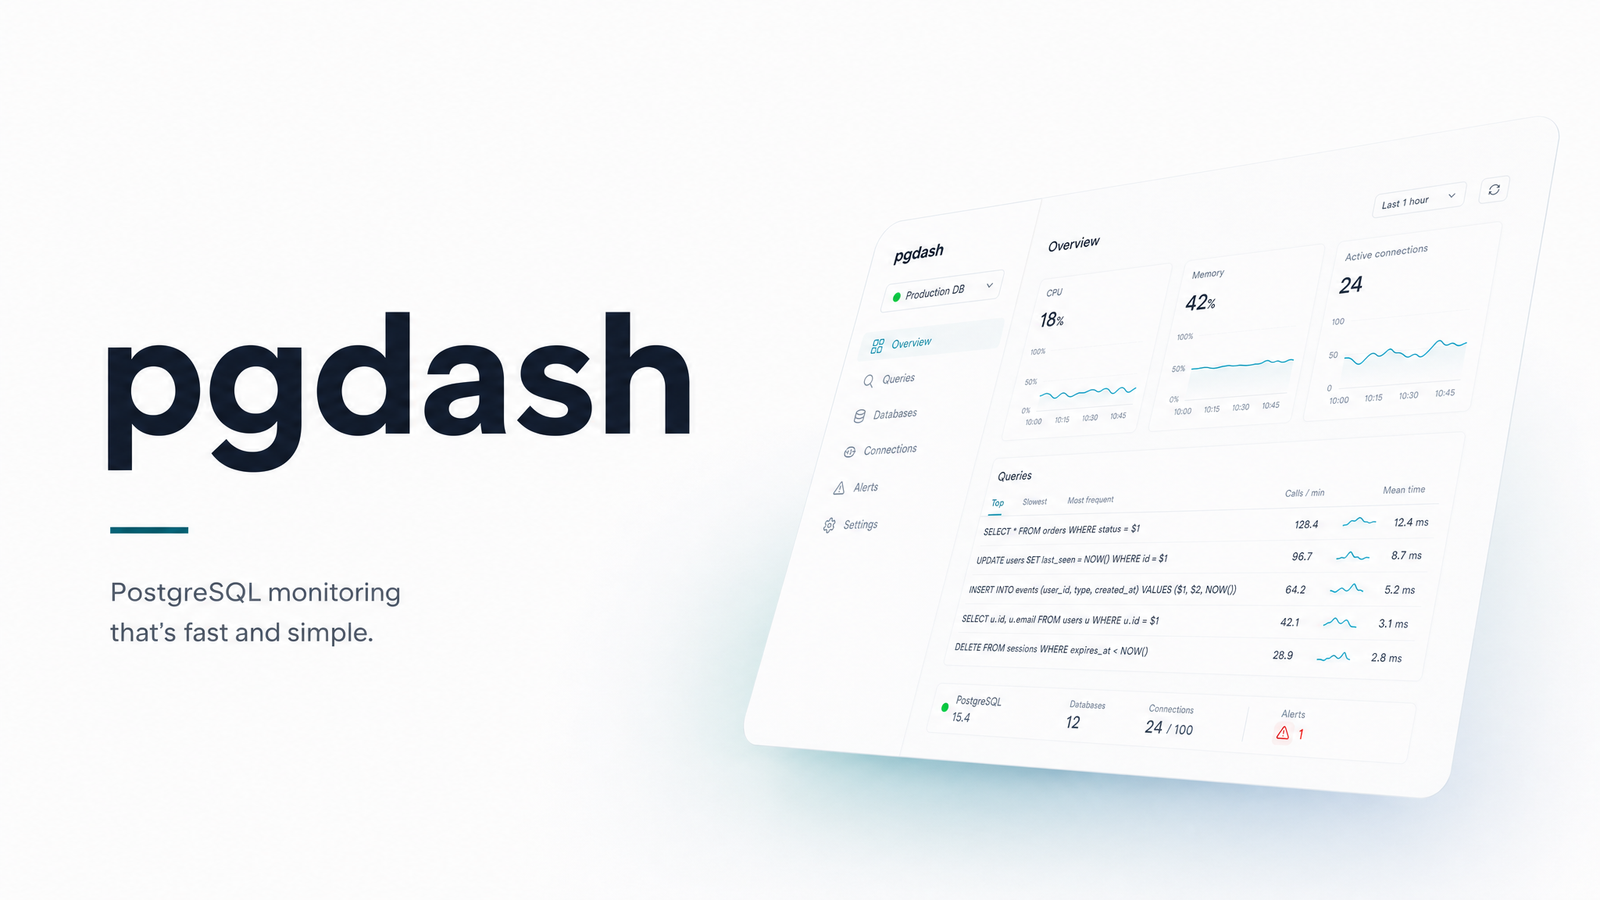
What Is pgDash?
pgDash is a PostgreSQL-specific monitoring and diagnostics SaaS built by RapidLoop. In short, it's a hosted dashboard that collects detailed metrics from your Postgres servers — table bloat, index usage, lock contention, replication lag, query performance — and presents them as historical charts and alerts, so admins can spot problems before they become outages.
Under the hood, pgDash relies on pgmetrics, an open-source command-line tool also maintained by RapidLoop, to collect raw data from each Postgres instance. pgmetrics runs a snapshot, gathers dozens of internal statistics, and ships them to pgDash's dashboard for storage and visualization over time. That separation matters: pgmetrics is free and usable standalone for one-off diagnostics, while pgDash is the paid layer that adds history, alerting, and team collaboration on top of it.
Core Features: What pgDash Actually Monitors
pgDash's feature set is built around Postgres internals rather than infrastructure or application-level concerns. Its postgresql monitoring coverage includes:
- Table and index metrics — bloat estimates, sequential vs. index scans, autovacuum activity, and dead tuple counts.
- Replication lag monitoring — tracking how far standby servers fall behind a primary, which matters heavily for teams running AWS RDS or Aurora clusters with read replicas.
- Lock and deadlock tracking — surfacing blocked queries and contention before they cascade into application timeouts.
- Diagnostics reports — point-in-time snapshots summarizing server health, useful when triaging a specific incident.
- Alerting — pgDash alerting pushes notifications through email, Slack, or PagerDuty when thresholds are breached, so teams don't have to keep the dashboard open.
- Team sharing — multiple engineers can access the same project, useful for on-call rotations.
- Deployment flexibility — pgDash supports managed Postgres (RDS, Aurora) as well as self-managed instances, and per Bytebase's comparison, self-hosted deployment is available across all of its plans, not gated behind an enterprise tier.
Nothing here targets connection pooling directly, but teams running PgBouncer in front of Postgres can still pull pgmetrics data from the primary database to catch issues like connection saturation that pooling is meant to prevent.
pgDash vs pganalyze: Pricing and Positioning
The two most commonly compared Postgres monitoring tools are pgDash and pganalyze, and the question usually comes down to depth versus cost. Per Better Stack's 2026 comparison, pgDash pricing starts at a Basic tier around $100/month and a Pro tier around $200/month. pganalyze sits in a similar or higher bracket depending on the plan, but its philosophy differs: it leans heavily into query-level advisory tooling, index suggestions, and EXPLAIN plan analysis aimed at query optimization specifically.
pgDash, by contrast, stays closer to general server health — bloat, locks, replication, and diagnostics — without as much automated query tuning advice. A breakdown of pganalyze alternatives frames pgDash as the simpler, cheaper option for teams who want solid visibility without paying for advisory depth they may not use. If your team already tunes its own queries and just needs alerting on operational stuff — lag, locks, disk bloat — pgDash's feature/price ratio is competitive. If you want automated query optimization guidance built in, pganalyze's extra cost may be justified.
Either way, both tools solve the same category of problem: is the database itself healthy. Neither answers a related but separate question — did the jobs that maintain that database actually run.
The Gap: pgDash Doesn't Watch Your Scheduled Jobs
This is where most evaluations stop short. pgDash — like pganalyze and pgmetrics-based tools generally — monitors what's happening inside Postgres: table state, replication status, lock queues, query plans. It has no mechanism to answer does pgDash monitor cron jobs, because that's not what it's built for. It watches the database's internal metrics, not the external processes that keep those metrics healthy in the first place.
Consider what actually keeps a Postgres deployment running well day to day: a nightly pg_dump backup script, a scheduled VACUUM cron job on a bloated table, an ETL sync pulling data into a reporting replica, or a periodic replication health check hitting a secondary region. All of these typically run as scheduled tasks — cron jobs, systemd timers, or CI-triggered scripts — completely outside pgDash's line of sight. If one fails, pgDash won't know, because nothing looks abnormal until the missing backup or unrun VACUUM job eventually causes a problem days or weeks later.
That's the core mechanism behind silent cron failure: a scheduled task can stop running — because of a bad deploy, an expired credential, a server restart that dropped the crontab entry — and nothing in your stack surfaces an alert. Backup job monitoring and vacuum cron job tracking aren't things a database metrics tool is designed to do, no matter how good its dashboards look. For more on why this failure mode is so easy to miss, see why cron jobs fail silently and the distinction between a syntax checker and an execution monitor — the same distinction applies here: pgDash validates database health, not job execution. If cron itself is unfamiliar territory, this primer on what cron jobs are is a useful starting point before wiring up monitoring for them.
Closing the Gap: Monitoring the Jobs Behind Your Database
This is the layer Cronevra covers. Instead of watching database internals, Cronevra watches the scheduled jobs themselves — the backup scripts, VACUUM cron jobs, ETL syncs, and replication checks that pgDash has no visibility into.
The mechanism is simple: your scheduled job sends an HTTP heartbeat ping to Cronevra when it starts and finishes. Cronevra logs that execution history, and if a job doesn't check in on schedule — because it crashed, got skipped, or the host itself went down — it triggers a recovery alert instead of leaving you to discover the gap later. This is cron job monitoring and scheduled job alerting built specifically for the failure mode that database dashboards can't see: the job that simply never ran.
Pairing the two tools gives full-stack coverage: pgDash tells you if your Postgres server is healthy right now; Cronevra tells you whether the maintenance work that keeps it healthy is actually happening on schedule. Neither replaces the other — they cover adjacent halves of the same reliability story.
If you're already running pgDash or pganalyze and want to close this gap, Cronevra adds heartbeat monitoring for the scheduled jobs feeding your database, and you can see plans on the pricing page to start monitoring your cron jobs today.
Frequently Asked Questions
What exactly does pgDash monitor on a PostgreSQL server?
pgDash monitors internal database metrics — table and index bloat, autovacuum activity, replication lag, lock and deadlock activity, and query performance — collected via the open-source pgmetrics tool. It displays these as historical dashboards and diagnostic reports, and supports both managed (RDS, Aurora) and self-managed Postgres instances.
Is pgDash free to use?
No, pgDash itself is a paid SaaS product, with Basic and Pro tiers priced around $100/month and $200/month respectively. Its underlying data-collection tool, pgmetrics, is open-source and free to use standalone for one-off diagnostic snapshots, but the hosted dashboard, alerting, and history require a paid pgDash subscription.
How is pgDash different from pganalyze?
pgDash focuses on general server health — bloat, locks, replication lag, diagnostics — at a comparatively lower price point, while pganalyze leans more heavily into query-level advisory features like automated index suggestions and EXPLAIN plan analysis. Teams that mainly need operational alerting tend to find pgDash's simpler, cheaper approach sufficient; teams wanting built-in query tuning guidance often lean toward pganalyze.
Can pgDash be self-hosted instead of used as SaaS?
Yes, pgDash offers a self-hosted deployment option in addition to its hosted SaaS version, and independent comparisons note this self-hosted option is available across all of its pricing plans rather than being restricted to a higher tier. This gives teams with data residency or compliance requirements a way to keep monitoring data in-house.
Does pgDash alert you if a scheduled backup or VACUUM job fails to run?
No, pgDash has no visibility into whether external scheduled jobs like backup scripts or VACUUM cron jobs actually executed. It only sees the resulting state of the database, so a missed backup or skipped VACUUM job won't trigger an alert until its downstream effects — like table bloat or storage growth — become visible in the metrics, often well after the fact.
What's a good lightweight alternative to pgDash for smaller teams?
For teams that mainly need to confirm scheduled jobs ran on time rather than deep database internals, a heartbeat-based cron monitoring tool like Cronevra is a lighter, cheaper complement rather than a replacement. Smaller teams often pair a minimal database check with Cronevra's job-level alerting instead of paying for pgDash's full internals dashboard before they need it.