IO Monitoring Explained (And What It Can't Tell You)
August 25, 2026
What Is I/O Monitoring?
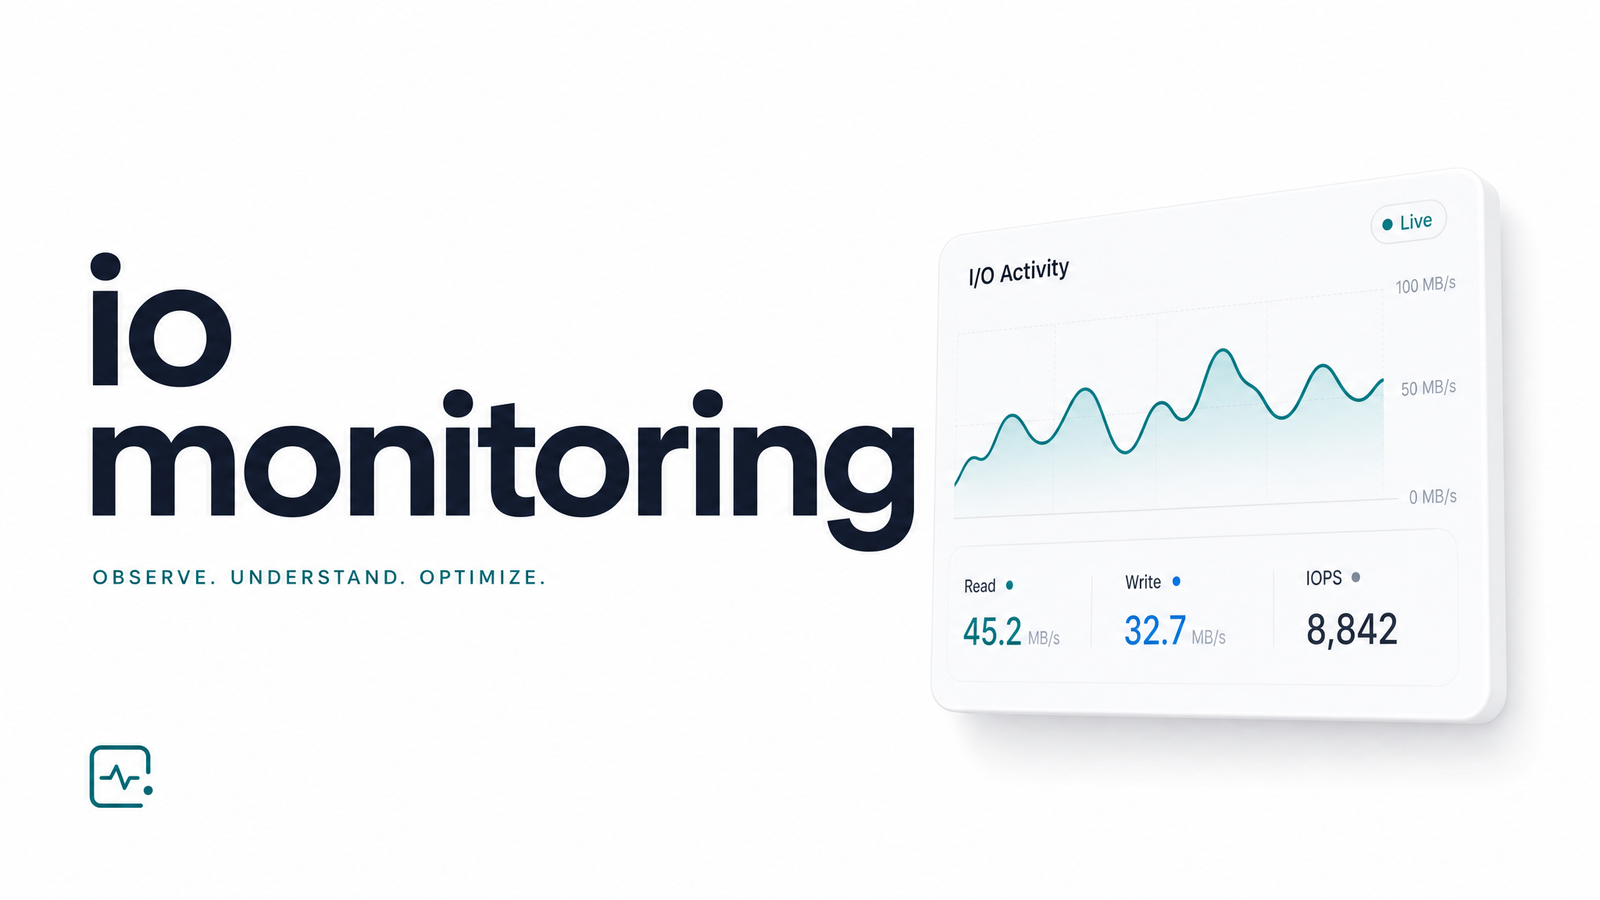
I/O monitoring tracks how data moves between a system and its storage or network interfaces — every read, every write, and how long each takes. When people ask "what is I/O monitoring" in a server context, they usually mean disk I/O: read and write operations hitting storage volumes as applications, databases, and background processes compete for disk access. Network I/O tracks data across interfaces rather than to disk, but disk-focused I/O monitoring is what most teams mean when troubleshooting slow applications.
It matters because disk performance is often the hidden bottleneck behind sluggish applications. CPU and memory graphs can look fine while a database query crawls waiting on disk reads, or a log-heavy service backs up because writes can't keep pace. Good I/O monitoring gives you visibility to catch that before users notice — and before an on-call engineer spends an hour ruling out everything except the actual cause.
The Core Metrics: IOPS, Throughput, Latency, and Utilization
Every I/O monitoring setup revolves around four numbers.
IOPS (Input/Output Operations Per Second) counts read or write operations completed per second. It's cited most often, but it's meaningless without context — a database doing small random reads reports vastly different IOPS than a video server doing large sequential writes. A sudden IOPS drop under steady load usually signals contention or a failing device.
Throughput measures data volume moved per second, typically in MB/s. Where IOPS counts operations, throughput measures bytes. High IOPS with low throughput usually means lots of small operations; low IOPS with high throughput means large, sequential transfers. Both matter, and neither tells the full story alone.
Latency is the time a single I/O request takes to complete, usually in milliseconds. This is the metric most directly tied to what users feel. A healthy SSD might average sub-millisecond latency; anything climbing into double digits consistently is worth investigating. Latency spikes without a corresponding IOPS or throughput spike often point to a storage-layer problem rather than an application one.
Disk utilization shows the percentage of time the device is busy servicing requests. Sustained utilization near 100% means the disk is a bottleneck even if IOPS and throughput look moderate — the device can't keep up with request queuing.
A bad reading on any one of these rarely tells you why something is wrong; it tells you where to look next.
Popular I/O Monitoring Tools
On Linux, a handful of command-line tools cover most day-to-day needs. iostat is the standard starting point, reporting IOPS, throughput, and utilization per device at set intervals. iotop narrows the view to which processes are generating I/O load right now, useful when a single runaway job is dragging on performance. vmstat gives a broader system snapshot — CPU, memory, and I/O together — handy for a first-pass health check. dstat combines several of these views into one customizable, real-time output, and sar (System Activity Reporter) logs historical data so you can look back at what happened before an incident was noticed.
These tools are excellent for point-in-time diagnosis on a single box, but they don't scale to fleets of servers or persist data long-term on their own. That's where observability platforms come in: Prometheus and Grafana are the common open-source pairing for collecting and visualizing I/O metrics across many hosts, while Datadog offers similar dashboards as a managed service with built-in alerting. All of them ultimately surface the same four core metrics — they just make it easier to watch dozens or hundreds of machines instead of one terminal at a time.
The Blind Spot: I/O Monitoring Doesn't Know If Your Job Ran
Here's the gap none of these tools close: I/O monitoring vs job monitoring are answering fundamentally different questions. I/O monitoring tells you whether the machine is healthy. It says nothing about whether the work that was supposed to happen actually happened.
Consider a nightly cron job that syncs data to a third-party API. The server shows normal disk utilization, IOPS within range, and sub-millisecond latency all night. Every infrastructure dashboard is green. But the job hangs on a network call that never times out, a downstream API starts silently returning errors, or the script exits early after an unhandled exception. None of that shows up as abnormal I/O — the process barely touches disk during a hung network wait. This is a textbook silent cron failure: the infrastructure looks fine because, from the machine's point of view, nothing went wrong. The job simply never finished.
This is precisely the distinction covered in Monitoring Check Types Explained: Which One Catches Cron — different check types answer different reliability questions, and infrastructure checks were never designed to answer "did this specific task complete successfully?"
Pairing I/O Monitoring With Job-Level Monitoring
A complete reliability stack needs both layers. Infrastructure metrics — I/O, CPU, memory — tell you the machine is capable of doing work. Execution monitoring tells you whether the work actually got done: did the job start on schedule, finish within its expected window, exit successfully, and hit the endpoint it was supposed to call?
That second layer is job monitoring, and it requires something fundamentally different from iostat or a Grafana dashboard: a system that expects a heartbeat from your scheduled task and alerts you the moment that heartbeat doesn't arrive. Missed cron job alerts, timeout detection, and run-history logs live at the application layer, not the disk layer — no amount of I/O tuning will produce them. For a broader look at how these layers fit together, System Health Checks: The Full-Stack Guide Devs Need walks through where I/O sits alongside CPU, memory, and application checks. And if you're already using a platform like Datadog for infrastructure, Datadog Uptime Monitoring vs. Cron Job Monitoring breaks down exactly why uptime checks and job checks aren't interchangeable.
This is the gap Cronevra was built to close. It watches your scheduled HTTP jobs directly — confirming start, completion, and success — and alerts you the moment a run fails, hangs, or never fires, independent of whether the underlying server looks healthy.
Frequently Asked Questions
Is I/O monitoring the same as disk monitoring?
Not exactly — disk monitoring is a subset of I/O monitoring. I/O monitoring covers both disk and network read/write activity, while disk monitoring specifically tracks storage-device performance like IOPS, throughput, and latency on local or attached drives.
What's a good IOPS value for a typical web server?
There's no universal number — it depends on workload and storage type. What matters more is consistency: a sudden drop in IOPS under the same load, or rising latency alongside stable IOPS, is a stronger warning sign than the raw IOPS figure itself.
Can I/O monitoring detect a stuck or hung process?
Sometimes, but only indirectly and unreliably. A process stuck waiting on disk will show elevated latency or utilization, but a process hung on a network call, a lock, or an unhandled exception often generates little to no unusual I/O, so it slips past I/O monitoring entirely.
Do I need I/O monitoring if I already use an APM tool?
Yes — they cover different layers. APM tools trace application code paths and requests, while I/O monitoring shows whether the underlying storage is a bottleneck; neither one confirms that a scheduled background job actually completed.
Will I/O monitoring alert me if my cron job doesn't run?
No. I/O monitoring tracks disk and network activity on the machine, not whether a specific scheduled task started, finished, or succeeded — a cron job can fail silently while every I/O metric stays perfectly normal.
What's the difference between buffered and direct I/O in monitoring output?
Buffered I/O passes through the OS page cache, so tools may report writes as complete before they're physically on disk, while direct I/O bypasses that cache and reflects actual device-level timing. This distinction matters when interpreting whether a latency spike reflects the disk itself or cache behavior.
I/O monitoring and job monitoring are two layers of the same reliability stack — one watches the machine, the other watches the work. If you only have the first, you'll find out about failures from angry users instead of alerts. Add the missing layer with Cronevra and get notified the instant a scheduled HTTP job fails, hangs, or never runs — check the pricing page to see which plan fits your team.