How to Monitor Uptime of a Website (Without False Positives)
September 21, 2026
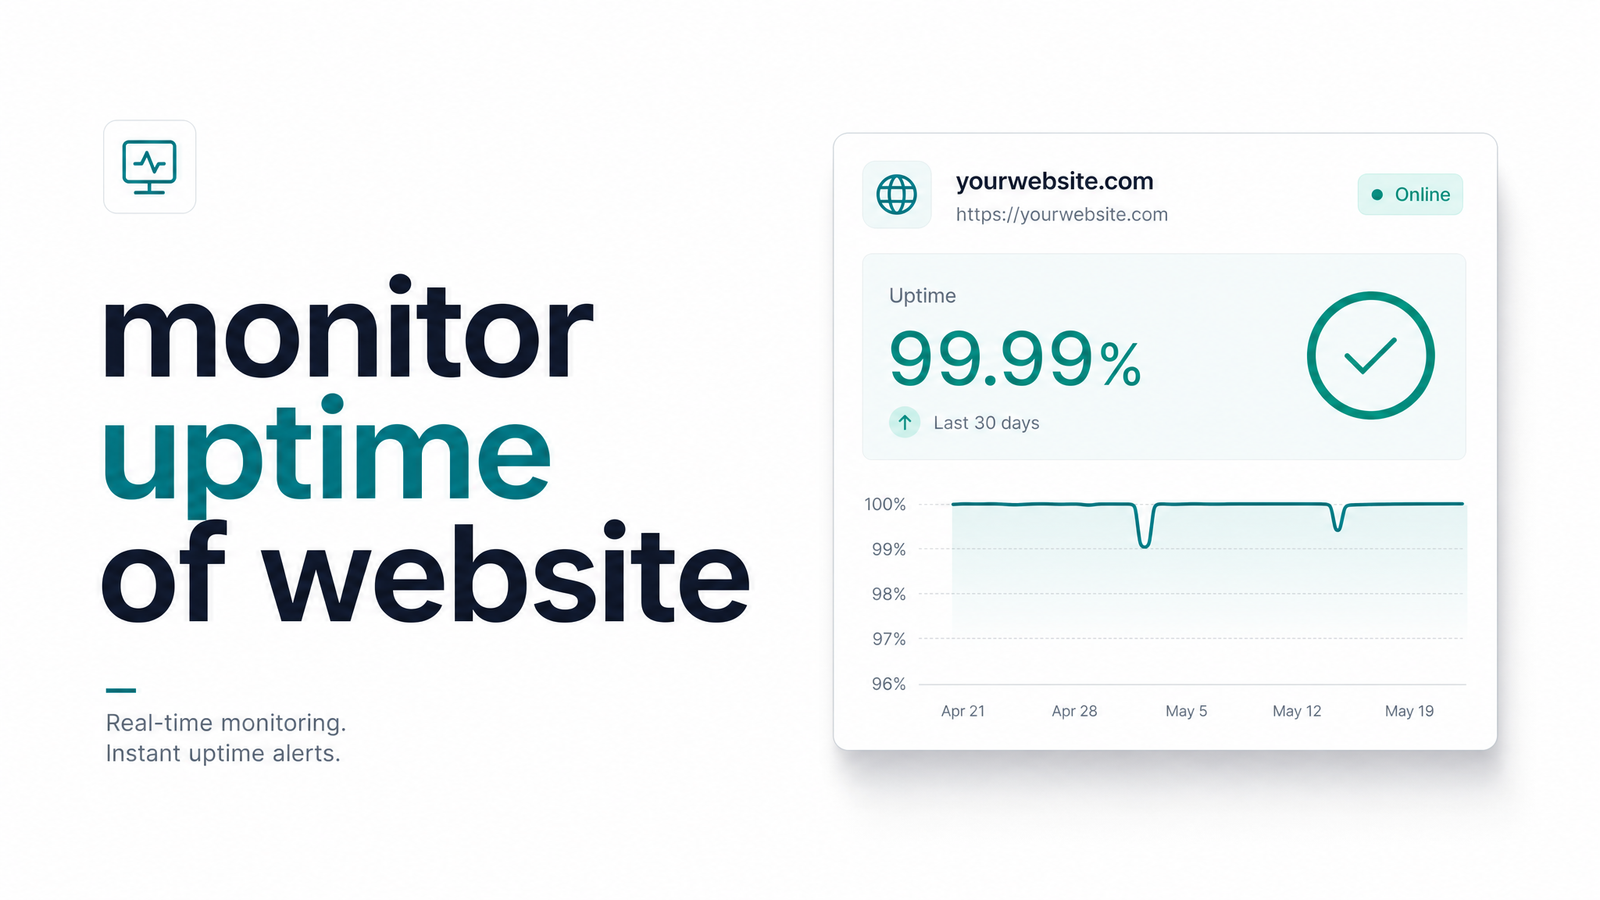
Most teams set up a single HTTP check, get a green checkmark, and assume the job is done. It isn't. Monitoring uptime well means understanding what a check actually verifies, how often to run it, what "up" means in SLA terms, and what it can never tell you about the systems running behind your site.
What Website Uptime Monitoring Actually Checks
Uptime monitoring is an automated process where a service sends requests to your site from external locations at regular intervals and records whether it responds, how fast, and with what content. That's the core of a website availability check: reachability, latency, and correctness — not just "is the server on."
A basic ping or HTTP check tells you the server accepted a connection. It doesn't tell you the page rendered correctly, the database returned real data, or a checkout flow completes. A server can be technically alive while the application it's serving is broken. UptimeRobot's guide to monitoring types breaks down HTTP, ping, DNS, and keyword checks in more depth — the short version is: a 200 status code is necessary for "up," not sufficient.
How to Set Up Uptime Monitoring in 4 Steps
Setting this up correctly is less about the tool you pick and more about the decisions you make before turning it on.
1. Pick the right check type. A plain HTTP check confirms the server responds. A keyword check searches the response body for text that should be present — "Add to Cart," a product price, a login form — and fails if it's missing, even with a 200 status. An SSL check watches your certificate's expiry date independently of whether the page loads. If your site depends on a certificate, an SSL check isn't optional.
2. Choose your check interval based on criticality. This is where most people over-monitor or under-monitor. A marketing site checked every 60 seconds generates alert noise from transient network blips. A revenue-critical checkout page checked every 5 minutes might sit broken for nearly 5 minutes before anyone knows. As a rule of thumb: 1-minute intervals for payment and login flows, 5-minute intervals for core pages, and 15–30 minutes for low-traffic or informational pages. The right interval is the shortest one your alert budget and infrastructure can tolerate without crying wolf.
3. Set alert thresholds and multi-location checks to reduce false positives. A single failed check from a single location is often just network jitter, not a real outage. Requiring two or three consecutive failures — or confirmation from a second geographic location — before firing an alert cuts false positives dramatically without meaningfully delaying real incident detection.
4. Route alerts to the right channel. A failed check at 3 a.m. needs to reach someone who can act: paging tools like PagerDuty or Opsgenie for critical services, a Slack channel or email digest for lower-priority ones. An alert nobody sees is functionally the same as no monitoring at all.
Reading Status Codes and Response Content Correctly
HTTP status codes come in families, and knowing them is what separates a real check from a rubber stamp. 2xx means success. 3xx means redirection, usually fine but worth watching if a redirect chain grows unexpectedly. 4xx means a client-side problem — a broken link, a missing page, a bad request — and 5xx means the server failed to handle the request. PingPing's guide to uptime monitoring covers retry logic and status code interpretation in useful detail for building alerting rules around these families.
Here's the false-positive trap: a server can return 200 OK while showing a database error message, a cached error page, an empty product grid, or content that's technically valid HTML but functionally useless. This is exactly what keyword checks catch — verifying that specific expected text appears in the response, not just that a response arrived.
SSL certificate monitoring deserves its own mention because certificate expiry is a silent killer. A cert can be valid Monday and expired by Friday with zero code changes, and browsers will block visitors entirely while your HTTP check might still show green if it's not configured to flag SSL state. Any serious availability check needs to monitor certificate expiry as a distinct signal from page reachability.
Uptime Percentage and SLA Math You Should Know
Uptime percentages sound similar but translate into very different amounts of real downtime. The formula: allowed downtime = total time × (1 − uptime%).
- 99% uptime allows roughly 7.3 hours of downtime per month
- 99.9% uptime allows about 43 minutes per month
- 99.99% uptime allows about 4.3 minutes per month
- 99.999% uptime allows about 26 seconds per month
For exact figures across the full range, Better Stack's availability table is a solid reference, and fivenines.io's SLA calculator is useful for running your own numbers and understanding the difference between an SLA (a contractual promise to customers), an SLO (an internal target you engineer toward), and an SLI (the measured indicator tracked against both). Setting "five nines" for an internal tool nobody depends on at 2 a.m. is usually wasted effort; setting it too low for a payment system is a business risk. Pick the number based on what actually breaks if you miss it.
What Uptime Monitoring Doesn't Cover: Scheduled Jobs Behind the Scenes
A passing uptime check confirms your site responds to requests right now. It says nothing about whether the nightly data sync ran, whether the cron job that renews subscriptions fired on schedule, or whether a scheduled API call that populates tomorrow's homepage actually completed. Your website can show 100% uptime for a month while a broken cron job quietly stops sending invoices or updating inventory in the background.
This is the core difference between uptime monitoring and cron job monitoring: uptime checks watch a request-response cycle, while scheduled job monitoring watches for expected events that may not involve a public endpoint at all. A dead man's switch style check — where a job must actively report in on schedule, and silence itself is the alert — is built for exactly this gap. We cover this blind spot in more detail in our piece on what uptime monitoring misses about scheduled jobs, and our guide to automated health checks is a natural next read.
Website uptime monitoring answers "is my site reachable" — it was never designed to answer "did my scheduled jobs run." If you're relying on cron jobs, nightly syncs, or scheduled HTTP tasks to keep that website's data and functionality correct, see how Cronevra monitors those jobs directly, with alerts when they go silent instead of just when your site goes down. Check Cronevra's pricing to get started.
Frequently Asked Questions
What's the difference between uptime monitoring and health checks?
Uptime monitoring verifies that a site or endpoint responds from an external vantage point, focusing on reachability and response time. Health checks go deeper, typically querying an internal endpoint that reports on the state of dependencies like databases, queues, or third-party APIs. A site can be "up" per uptime monitoring while a health check reveals a failing dependency underneath.
How often should I check my website's uptime?
It depends on how critical the page is: 1-minute intervals for payment and login flows, 5-minute intervals for core pages, and 15–30 minutes for low-traffic pages. Checking too frequently on non-critical pages mostly generates noise, while checking too infrequently on critical ones delays real incident detection.
Does a 200 status code always mean my website is working?
No. A server can return 200 OK while showing a database error, an empty page, or stale cached content, because the status code only confirms the server responded, not that the response is correct. Keyword or content checks that verify specific expected text in the response catch these soft failures.
What uptime percentage should I aim for?
It should match what actually breaks if you miss it, not an arbitrary industry number. 99.9% allows about 43 minutes of downtime per month, while 99.99% allows roughly 4.3 minutes — pick the target based on the cost of downtime for that specific service, not blanket ambition.
Can uptime monitoring tell me if my cron jobs or scheduled tasks failed?
No, uptime monitoring only checks whether a public-facing endpoint responds, and most scheduled jobs never touch that endpoint directly. You need dedicated cron or scheduled job monitoring, often using a dead man's switch pattern, to know whether background tasks actually completed.
What's the cheapest way to monitor website uptime?
A single HTTP check on a generous interval with a free-tier monitoring tool covers basic reachability at minimal or no cost. The tradeoff is coverage: without keyword checks, SSL monitoring, and multi-location verification, you'll catch full outages but miss soft failures like broken pages or expiring certificates.