Datadog Uptime Monitoring vs. Cron Job Monitoring
August 24, 2026
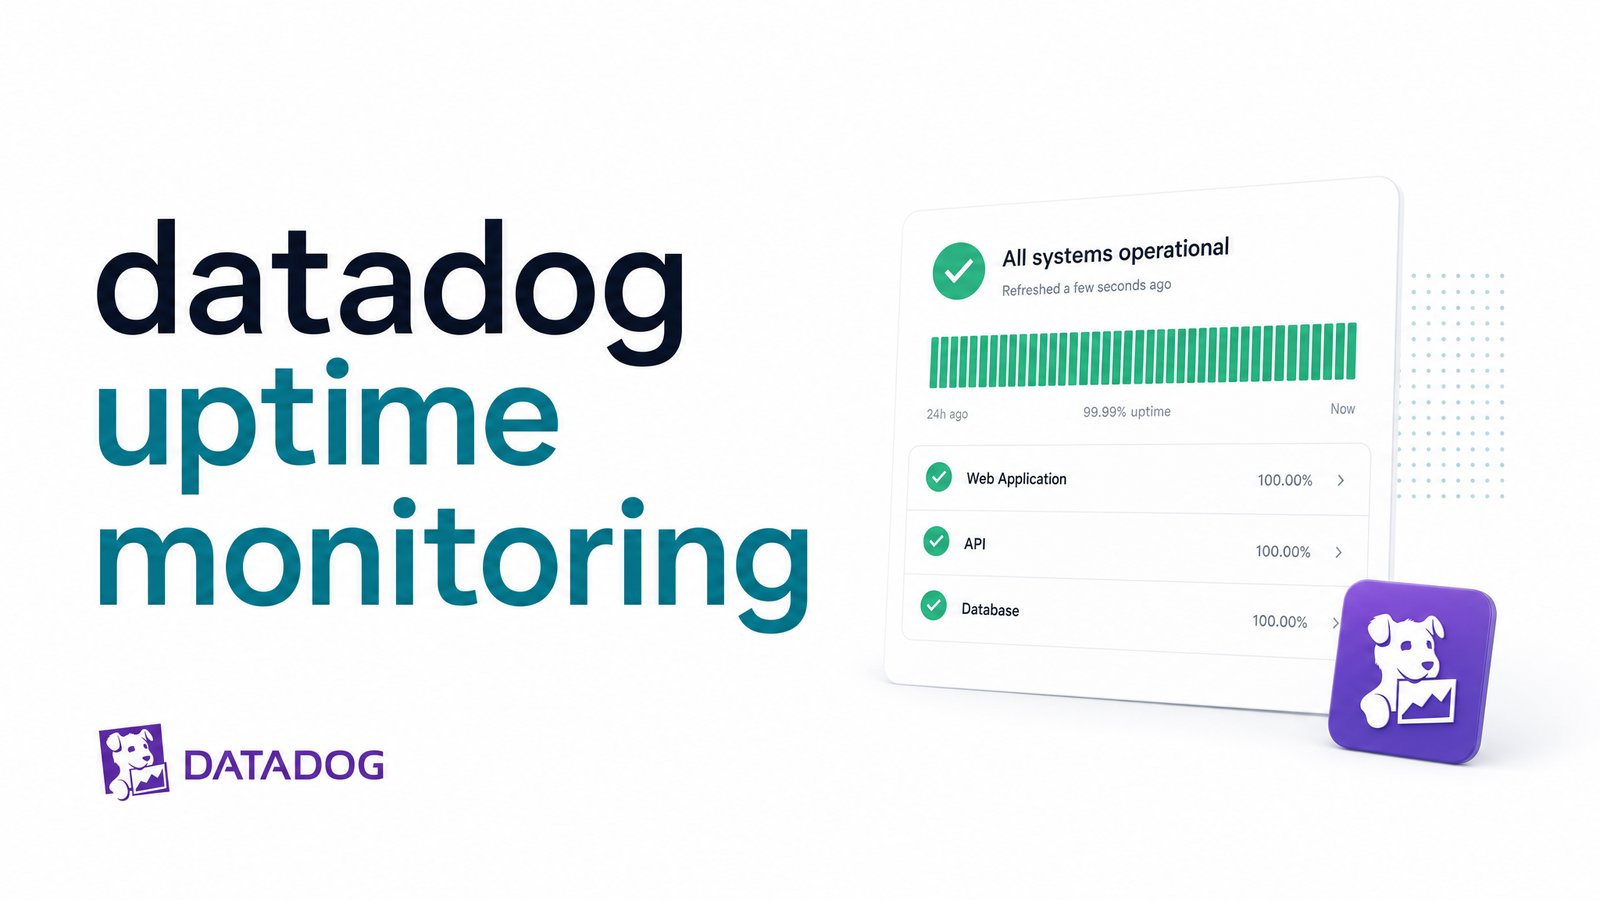
Teams that already run Datadog often assume it has cron jobs covered. It doesn't, out of the box. Datadog's uptime monitoring answers a narrower question than most engineers think, and knowing that boundary is the fastest way to stop scheduled jobs from failing silently while dashboards stay green.
What Datadog Uptime Monitoring Actually Checks
Datadog's uptime checks are part of its Synthetic Monitoring product: they verify that a public or private endpoint responds, from various global locations, on a schedule you define. These are API and browser tests — simulated HTTP, SSL, DNS, and TCP requests that check status codes, response times, certificate validity, and content assertions against a URL.
Per Datadog's getting started documentation, synthetic tests operate at the HTTP, browser, and API layers, sending requests on a fixed interval and evaluating the response against defined assertions. Datadog also layers SLO tracking on top of this data — its Uptime Monitor template calculates availability by counting the proportion of checks that returned a healthy status code over a time window.
This is genuinely useful for confirming your marketing site loads, your login page renders, your public API responds with a 200, or your checkout flow doesn't break after a deploy — an outside-in view of availability. None of that is built to answer questions about work that happens on a schedule inside your infrastructure rather than in response to a request.
The Gap: Endpoint Uptime vs. "Did the Job Actually Run and Succeed?"
An uptime check confirms a URL responded. It says nothing about whether a batch job processed the records it was supposed to, whether a nightly export completed, or whether a scheduled task even attempted to run. Cron jobs aren't endpoints waiting for a request — they're processes supposed to initiate themselves on a timer, and if they don't fire at all, there's no request for Datadog's synthetic checks to test.
This is where silent cron failure becomes a real operational risk. A job that used to run at 2 a.m. and quietly stops — because a deploy broke the scheduler, a container didn't restart, or a dependency changed — produces no failed HTTP call for Datadog to catch. Nothing errors, nothing times out. The absence of an event is the failure, and absence is exactly what request-based uptime monitoring isn't built to detect.
Datadog does offer a workaround: heartbeat monitoring via DogStatsD. The pattern is to have each cron job emit a custom metric (or log line) at the start and/or end of execution, then build a monitor that alerts if that metric hasn't been received within an expected window. This is the standard answer when people search for cron job monitoring datadog — but it requires instrumenting every job yourself, deciding on a metric name and tag scheme, and maintaining that as jobs are added, renamed, or removed.
What It Takes to DIY Cron Monitoring in Datadog
Setting this up for real means a few concrete steps per job. First, add a dogstatsd cron call to the job's code or wrapper script so it emits a custom metric on each run. Second, write a monitor with a threshold tuned to that job's specific schedule — a job running every five minutes needs a very different missed-run window than one running nightly, and getting the threshold wrong means either alert fatigue or missed failures. Third, decide whether to track success/failure state separately from the heartbeat itself, which usually means additional tags or a second metric.
None of this scales gracefully. Datadog's custom metrics pricing is usage-based, and teams that instrument metrics per job, per environment, often per host, find the bill grows with every job added — a recurring complaint in independent analyses of cron monitoring tools. Log-based monitors carry similar ingestion-volume costs if you're piping execution logs through Datadog's log pipeline just to detect a missing entry. The setup burden is also ongoing: every new scheduled job means new instrumentation, a new monitor, and a new threshold, and every job that changes cadence means revisiting that math. For a full breakdown of how uptime checks, heartbeats, and healthchecks differ mechanically, see this comparison of monitoring check types.
When to Pair Datadog with a Dedicated Cron Monitor
The practical framework: keep Datadog doing what it's genuinely good at — infrastructure metrics, APM traces, endpoint and browser synthetic checks, log aggregation across your stack — and stop trying to bend it into a job-execution tracker it wasn't designed to be. A datadog vs cron monitoring comparison usually comes down to this: Datadog monitors whether your systems are reachable and responsive, while a dedicated cron monitor tracks whether a specific scheduled task ran, how long it took, whether it succeeded, and what happened the last time it failed.
This is precisely the gap Cronevra fills as a datadog alternative for cron jobs — not a replacement, a complement. Instead of writing DogStatsD calls and tuning custom monitor thresholds per job, you point a scheduled HTTP job at Cronevra and get execution history, missed-run detection, and failure alerts without touching your Datadog metric budget. As a cron monitoring tool, its entire job is the thing Datadog treats as an afterthought: confirming each run actually happened and succeeded, and surfacing exactly which run failed and why. Because it's not billed on custom metrics or log volume, the cost model stays predictable as you add jobs — worth comparing directly on Cronevra's pricing page against what per-job DogStatsD instrumentation would cost at scale.
If your team is already paying for Datadog to watch endpoints and infrastructure, the fastest fix isn't more custom instrumentation — it's adding a tool built specifically for scheduled job execution. Cronevra takes about five minutes to wire into an existing cron or scheduled HTTP job, with no DogStatsD plumbing, no custom metric tuning, and a failure alert the moment a run doesn't show up as expected.
Frequently Asked Questions
Does Datadog monitor cron jobs out of the box?
No. Datadog's built-in Synthetic and uptime monitoring checks whether an endpoint responds to a request — it has no native concept of a scheduled job that's supposed to run on its own. Detecting cron execution requires manually instrumenting each job with a custom metric or log line and building monitors around it.
Can I use Datadog Synthetic Monitoring as a heartbeat check for scheduled tasks?
Only indirectly, and only if your job exposes an HTTP endpoint that Synthetic Monitoring can poll — most cron jobs don't. The more common approach is DogStatsD heartbeat monitoring, where the job itself emits a custom metric that a monitor checks for within an expected time window.
What's the difference between uptime monitoring and cron job monitoring?
Uptime monitoring confirms a URL or service responds to a request; cron job monitoring confirms a scheduled task actually executed and completed successfully. A job can fail to run at all — with no request ever made — which uptime checks structurally cannot detect, since they only test things that respond to being pinged.
Is Datadog overkill just for tracking cron job failures?
For teams whose only need is cron execution tracking, yes — Datadog requires custom metric instrumentation, monitor configuration, and usage-based billing for something a purpose-built tool handles natively. It makes more sense as infrastructure and endpoint observability, with a dedicated cron monitor layered on top for job-level tracking.
Can I use Datadog and a dedicated cron monitoring tool together?
Yes, and this is the most common practical setup: Datadog continues handling infrastructure metrics, APM, and endpoint uptime checks, while a tool like Cronevra tracks scheduled job execution history and failure alerts. They cover different layers of the stack rather than competing.
How much does it cost to build custom cron alerting in Datadog?
There's no fixed number, but the cost scales with usage: each job typically needs its own custom metric or log line, and Datadog bills for custom metrics and log ingestion volume as you add more jobs. Teams monitoring dozens of scheduled tasks often see this add up faster than a flat-rate dedicated cron monitoring tool.