API Uptime Monitoring: What It Misses About Scheduled Jobs
September 21, 2026
What Is API Uptime Monitoring, Exactly?
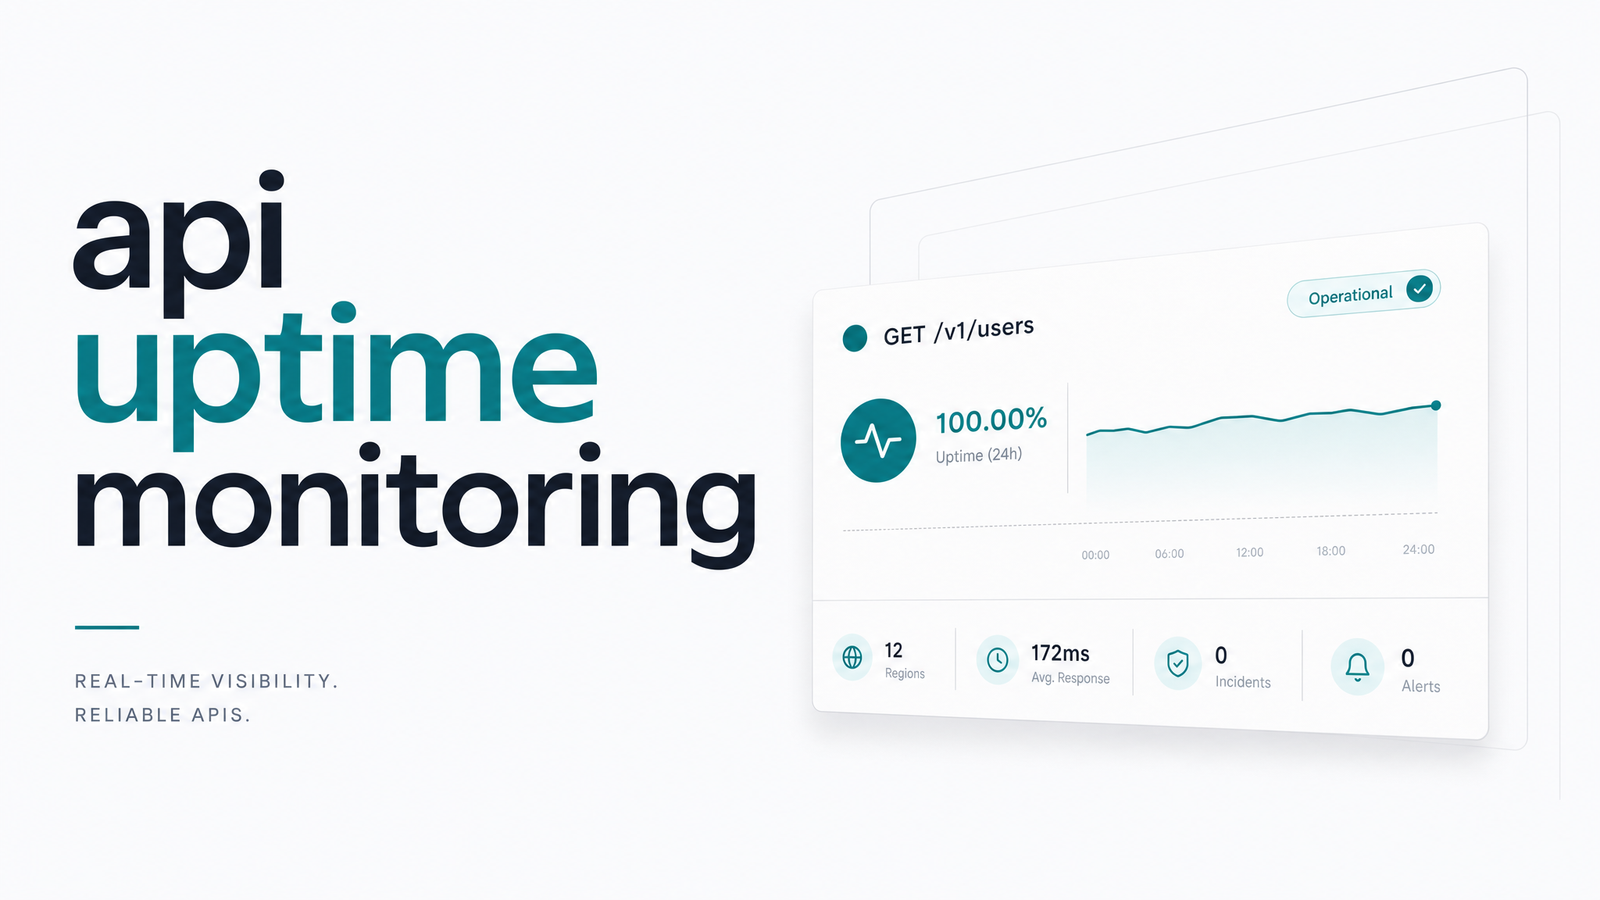
API uptime monitoring periodically pings an endpoint — usually every 30 seconds to a few minutes — to confirm it responds, how fast, and how long it stays down when it doesn't. The output is an uptime percentage: 99.9% ("three nines") allows roughly 8.7 hours of downtime per year, while 99.99% cuts that to about 52 minutes. These benchmarks show up in nearly every SLA because they're easy to measure. IBM's overview of API monitoring covers this convention: checks track status codes, latency, and availability windows, giving teams a baseline signal for "is this thing alive."
In practice, a synthetic request hits a health or root endpoint from one or more regions and logs whether it got a 2xx response in time. That's genuinely useful — it catches DNS failures, server crashes, expired certificates, and network partitions. But availability only answers one narrow question: can a client reach the server and get any response? It says nothing about whether the code behind that response did what it was supposed to do — exactly where things get interesting for teams running scheduled or background work.
The '200 OK' Illusion: Why Passing Uptime Checks Aren't Enough
A 200 OK means the server accepted the request and returned a response — it does not mean the business logic succeeded. An endpoint can authenticate fine, return 200, and still fail to write to the database, call a downstream service, or process the payload correctly. This is the 200 OK illusion: green checkmarks while something underneath is quietly broken.
Dotcom-Monitor's analysis of API uptime monitoring makes a similar point — basic reachability checks measure whether the door is open, not whether anything useful happens once you walk through it. That gap between API availability and API functionality is where a lot of production incidents hide. A checkout API can accept requests all day while its inventory sync silently drops updates; a reporting endpoint can return 200 while the report it generates is empty or stale.
The stakes are real. According to Gatling's 2026 downtime cost research, outages and degraded reliability carry direct revenue impact, recovery labor, and trust costs that compound the longer an issue goes undetected. A monitoring setup that only tracks uptime percentage can report a clean month while a critical process failed for days — because nobody checked whether the work actually got done, only whether the endpoint answered the phone.
The Real Blind Spot: Scheduled and Background API Jobs
This is where generic uptime monitoring runs out of road. Teams running cron-triggered API calls, webhook consumers, ETL syncs, or nightly batch endpoints often wire up an uptime check against the trigger URL and call it done. The check pings the endpoint, gets a 200, and reports green — even if the scheduled task never actually executed, timed out midway, or threw an exception after accepting the request.
This is silent job failure, and it's uniquely hard to catch with uptime tooling because the failure happens after the HTTP response, not during it. A cron job api monitoring gap looks like this: an endpoint that kicks off a data sync accepts the trigger and returns 200 immediately, then the sync process crashes three steps in. Your uptime monitor sees success; your users see missing data days later.
Scheduled job monitoring for APIs needs a different signal — not "did the server respond" but "did the job that was supposed to run at 2 a.m. actually run, and finish." That distinction is the entire reason execution monitoring exists as a separate discipline. For a deeper look at designing checks that confirm completion rather than just reachability, see this guide to automated health checks.
Uptime Monitoring vs. Execution Monitoring: Two Layers, Not Rivals
Think of this as two separate layers, each answering a different question. Uptime monitoring answers: is the server reachable right now? Execution monitoring answers: did the specific job that was supposed to run actually run, complete, and succeed?
Execution monitoring typically relies on heartbeat monitoring — your job pings a monitoring service when it starts and again when it finishes, or reports success/failure explicitly. If the expected heartbeat doesn't arrive within a defined window, that's the signal, not a missing HTTP response. This pattern is often called a dead man's switch: the alert fires from the absence of a signal, not the presence of an error — exactly what catches jobs that hang, crash silently, or never trigger at all.
Framed this way, uptime monitoring vs. execution monitoring isn't a competition — one covers infrastructure reachability, the other covers task correctness and completion. Teams that assume uptime monitoring implies execution monitoring are the ones blindsided by the 200 OK illusion. This framework for scheduling cron jobs without silent failures walks through structuring that second layer.
Building a Complete API Reliability Checklist
A genuinely complete api monitoring checklist covers both layers. For uptime and reachability:
- HTTP status code on every request, not just the happy path
- Response latency against a defined threshold
- SSL certificate expiration and validity
- Multi-region checks to rule out localized network issues
- Historical uptime percentage tracked against your SLA target
For scheduled and triggered jobs, you need signals uptime checks can't provide:
- Last-run timestamp for every cron job or scheduled task
- Expected timeframe alerts — flag a job that hasn't reported in within its normal window
- Explicit success/failure status reported by the job itself, not inferred from a status code
- Duration tracking, so a job that "completes" but takes 10x longer than usual gets flagged
- Retry and recovery alerts tied to the specific job, not the endpoint that triggered it
An uptime monitor tells you the server answered. It cannot tell you whether the nightly sync, webhook processor, or batch export actually did its job — that requires watching the task itself, not the door it walked through.
If you're running scheduled or triggered HTTP jobs and only have uptime checks in place, you have exactly half the picture. Cronevra adds the execution layer that uptime monitoring was never designed to cover — tracking last-run status, flagging missed or failed runs, and alerting you before a silent failure turns into a data gap your users notice first. Check the pricing page to see which plan fits your job volume.
Frequently Asked Questions
Does API uptime monitoring tell me if my cron job actually ran?
No. Uptime monitoring only confirms an endpoint returned a response, typically a 200 status code — it can't see whether the process triggered by that request completed. A cron job can fail after accepting the trigger request while the uptime check still reports success.
What uptime percentage should I aim for on a production API?
Most production APIs target 99.9% uptime (about 8.7 hours of downtime per year), while stricter SLAs aim for 99.99%, roughly 52 minutes annually. The right target depends on how critical the endpoint is and what your customers or contracts require.
What's the difference between uptime monitoring and heartbeat monitoring?
Uptime monitoring pings an endpoint from the outside to check reachability, while heartbeat monitoring waits for a signal sent by the job itself when it starts and finishes. Heartbeat monitoring, often implemented as a dead man's switch, catches jobs that never trigger or hang silently — failures an outside ping can't detect.
Can an API show 100% uptime and still be broken for users?
Yes. An endpoint can return 200 OK on every request while the business logic behind it fails — a database write that doesn't commit, a downstream call that times out, or a scheduled task that never actually runs. This is the core limitation of measuring availability without measuring functionality.
How often should an API uptime check run?
Most teams run checks every 30 seconds to 5 minutes, depending on how quickly they need to detect downtime and their monitoring budget. Critical, revenue-facing endpoints generally warrant the shorter interval; internal or low-traffic services can tolerate longer gaps.
Do I need both an uptime monitor and a job/execution monitor?
Yes, if you run any scheduled or triggered background work behind your API. Uptime monitoring confirms the server is reachable, while execution monitoring confirms the specific job actually ran and succeeded — relying on only one leaves a real gap, especially for cron jobs, webhook processors, and batch syncs.